CircNetVis
Abstract
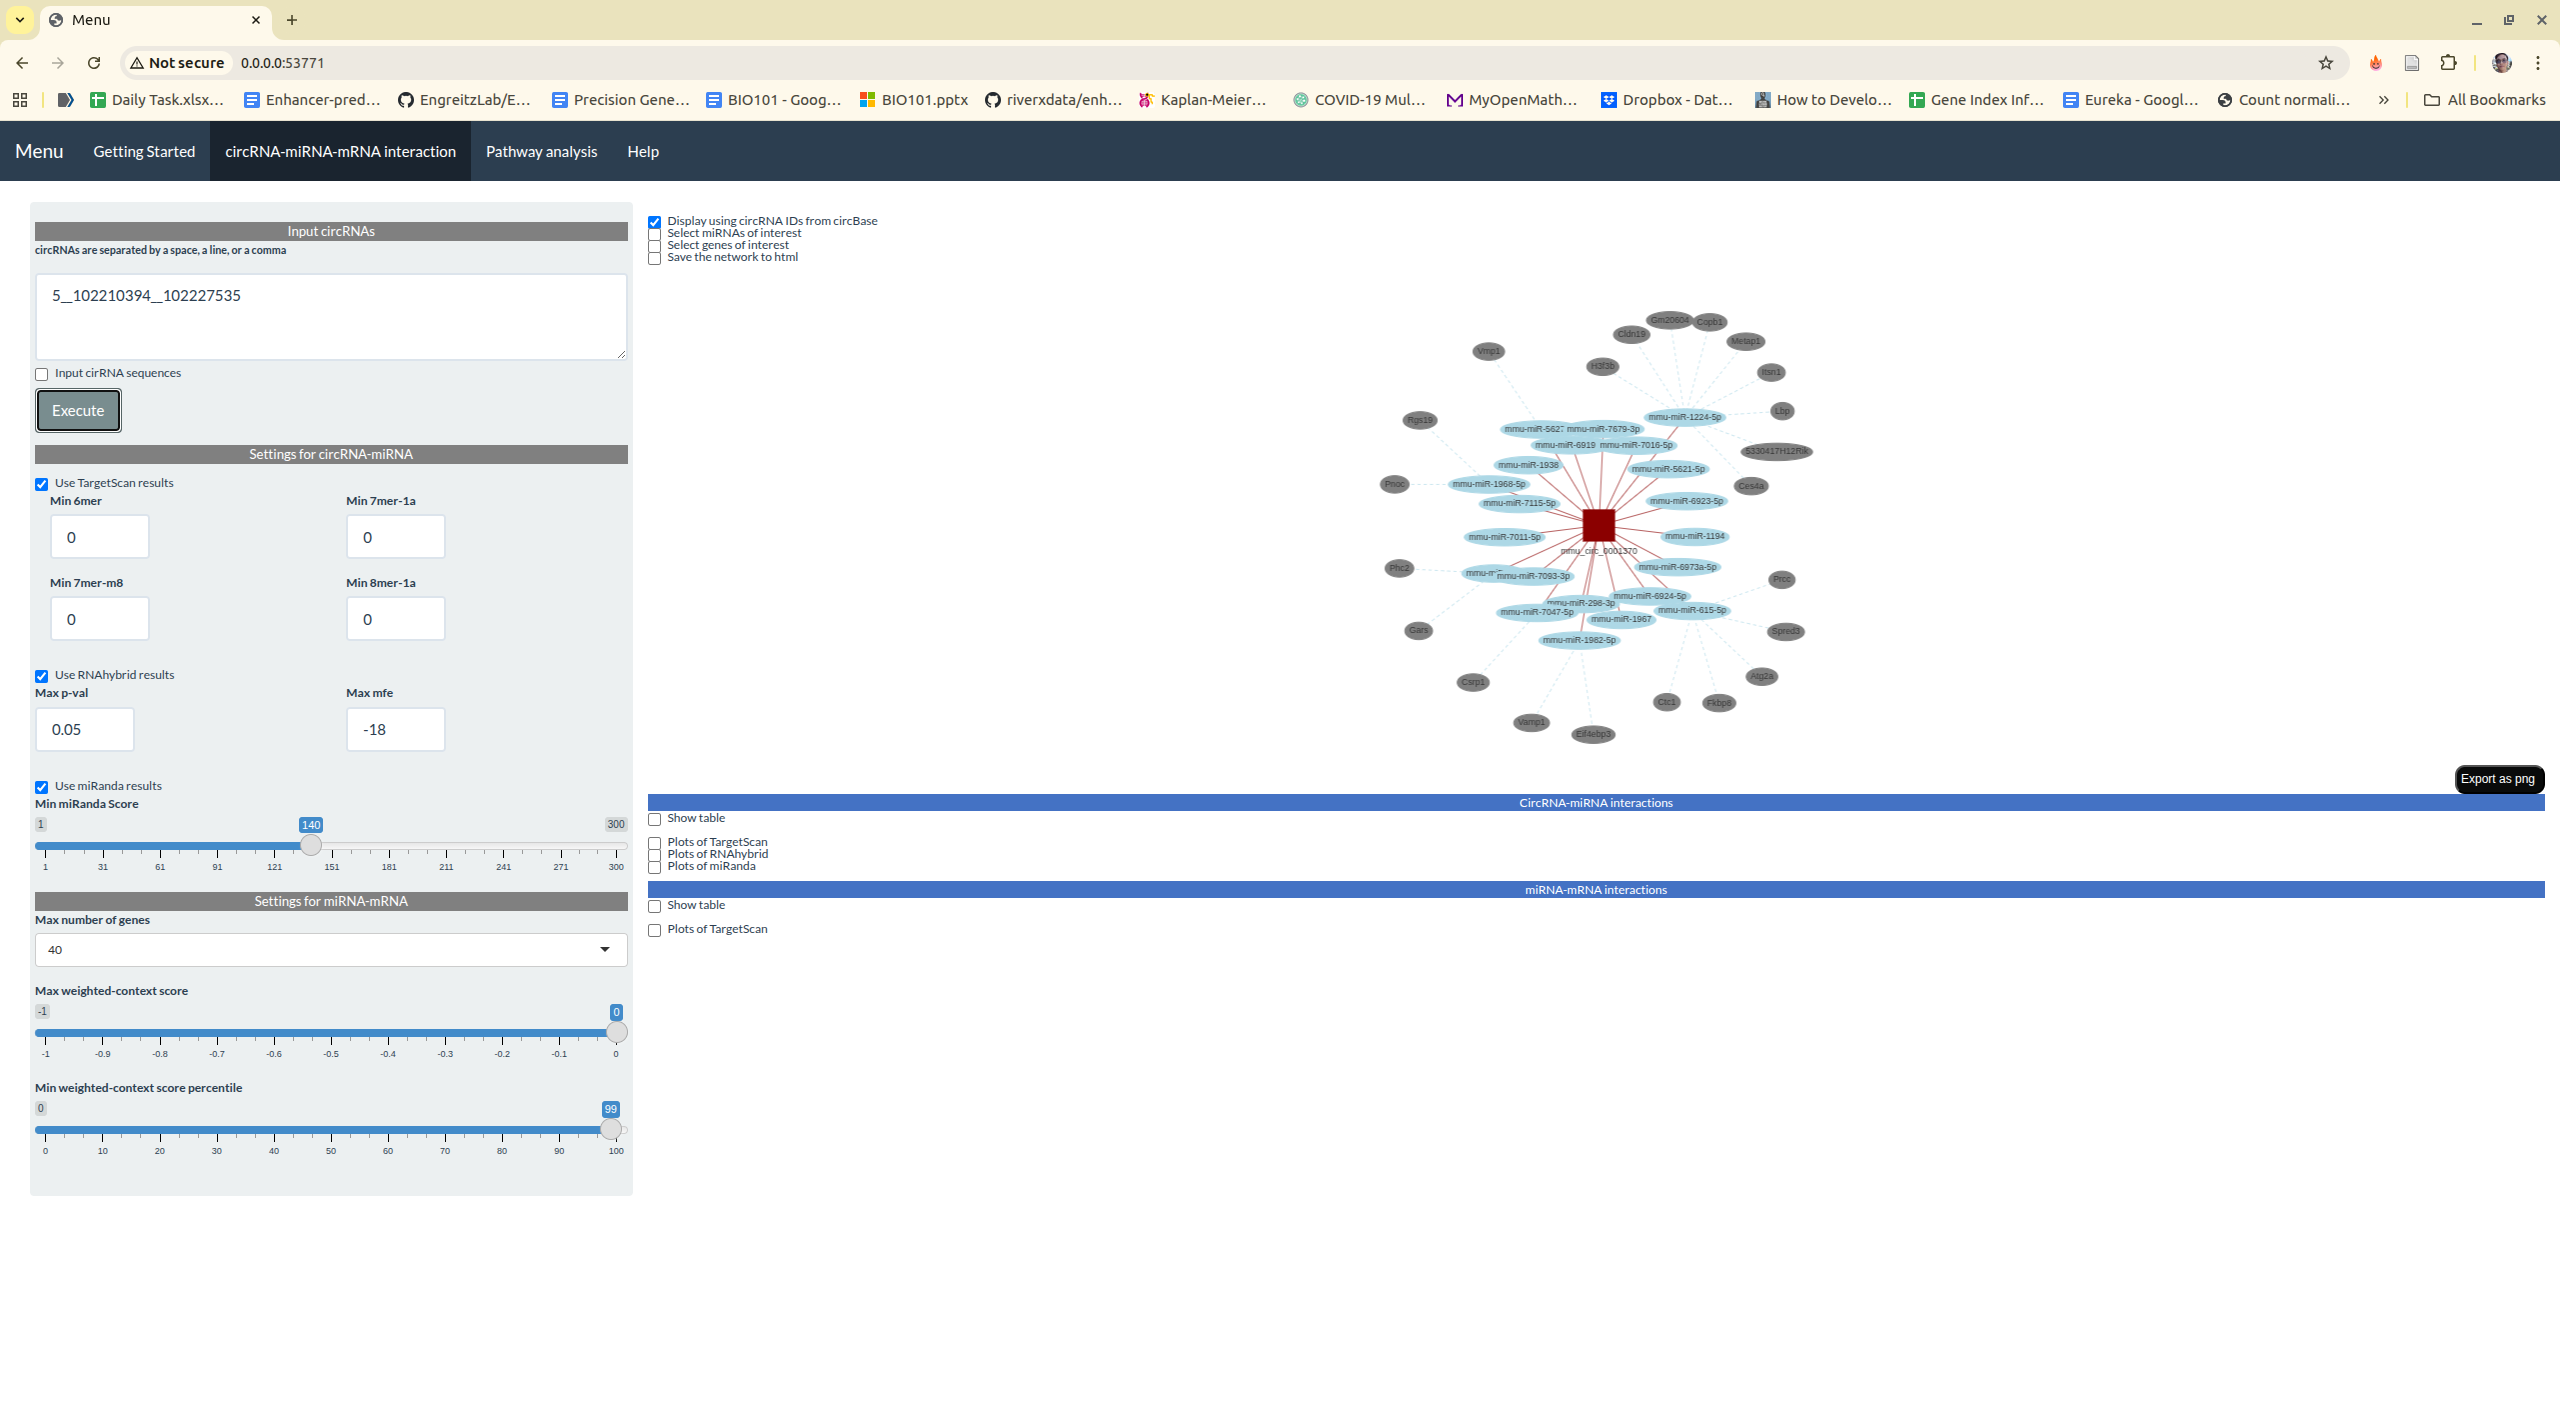
Analyzing the interactions of circular RNAs (circRNAs) is a crucial step in understanding their functional impacts. While there are numerous visualization tools available for investigating circRNA interaction networks, these tools are typically limited to known circRNAs from specific databases. Moreover, these existing tools usually require complex installation procedures which can be time-consuming and challenging for users. There is a lack of a user-friendly web application that facilitates interactive exploration and visualization of circRNA interaction networks. CircNetVis is an interactive online web application to enhance the analysis of human/mouse circRNA interactions. The tool allows three different input formats of circRNAs including circRNA IDs from CircBase, circRNA coordinates (chromosome, start position, end position), and circRNA sequences in the FASTA format. It integrates multiple interaction networks for visualization and investigation of the interplay between circRNA, microRNAs, mRNAs and RNA binding proteins. CircNetVis also enables users to interactively explore the interactions of unknown circRNAs which are not reported from previous databases. The tool can generate interactive plots and allows users to save results as output files for offline usage. CircNetVis is implemented as a web application using R-shiny and freely available for academic use at https://www.meb.ki.se/shiny/truvu/CircNetVis/.
Citation
@article{nguyen2024circnetvis,
  title={CircNetVis: an interactive web application for visualizing interaction networks of circular RNAs},
  author={Nguyen, Thi-Hau and Nguyen, Ha-Nam and Vu, Trung Nghia},
  journal={BMC bioinformatics},
  volume={25},
  number={1},
  pages={31},
  year={2024},
  publisher={Springer}
}
RIVER integration
- It is the public tools, new configuration is added to run on RIVER
- Availble at: https://github.com/riverxdata/bioinfor-sw-CircNetVis
Step 1: Fork the Repository
Fork TFFinder if you're not the owner. See GitHub forking documentation.
Step 2: Clone the Repository
git clone git@github.com:riverxdata/bioinfor-sw-CircNetVis.git
cd bioinfor-sw-CircNetVis
Step 3: Add Testing Infrastructure
git clone git@github.com:riverxdata/web-template-analysis.git
cp -r web-template-analysis/tests tests
rm -rf web-template-analysis
Step 4: Create the RIVER Integration
Create river/main.sh with the following content:
cd analysis
# Download the database files
if [ -d "CircNetVis/Tools" ]; then
    echo "Database already exists."
else
    wget https://zenodo.org/records/10394426/files/CircNetVis_database.tar.gz?download=1 -O CircNetVis_database.tar.gz
    tar -xvzf CircNetVis_database.tar.gz -C CircNetVis --strip-components 1
fi
# Run the Shiny app
eval "$(pixi shell-hook)"
Rscript -e "shiny::runApp('CircNetVis_mm9')"
Final directory structure:
For the sub folder river, it is similar to previous python web application
├── CircNetVis
├── CircNetVis_mm9
├── License
├── pixi.lock
├── pixi.toml
├── README.html
├── README.md
├── river
├── tests
└── work
Step 5: Test Locally
bash tests/run_local.sh
The terminal will display access URLs:
CircNetVis_mm9 resources already exist.
Loading required package: shiny

Listening on http://127.0.0.1:3411
Step 6: Release on the platform
There are 2 models: Human vs mouse Instead of creating the paramter to select which Shiny app is used, it can be simply tagged with different model On the RIVER UI, you can select the tag to deploy your specific model. After commit the repository, you can create and push your tag to github
git tag v1.0.0
git push origin main
git push origin v1.0.0